Global Black Friday Statistics for 2021: What You Need to Know
From past performance patterns to potential holiday trends, discover Black Friday statistics to help you conquer the busiest sales day of the year.
Black Friday 2021 was one for the books. After the shift to digital that COVID spurred, we expected there to be a bigger number of consumers finally stepping out of their homes to shop IRL this year, and for mobile to make a comeback as more people adjust to using social media for discovering and browsing products online.
Predictions aside, we know all too well the volatility 2020 brought to the shopping market, leaving many of us unsure what Black Friday would look like this year. After all, in 2020, some industries unexpectedly saw a surprising rise in ecommerce sales—while other, historically successful verticals, struggled to stay afloat.
Even if the picture was unclear going into Black Friday 2021, we made sure to capture every last bit of data to bring you a detailed Black Friday statistics report that doesn’t miss a beat. Read on to get some of the highlights:
Statistics and Trends Overview
- Black Friday 2021 performance
- Black Friday U.S. vs. UK sales
- Black Friday vs Cyber Monday by year
- Black Friday retail trends
Black Friday 2021 performance by region, industry, and device
Our team knuckled down to track performance across millions of Nosto-powered interactions in multiple regions, industries, and device types. We highlight the differences in this data compared to 2020.
Here are the Black Friday statistics for year-over-year performance:
Performance Data by Region
Median percentage differences (2021 vs. 2020) as of 12:00 AM UTC on Friday, November 26 until 12 PM UTC on Monday, November 29, 2021.
| REGION | AOV | CONVERSION RATE | SALES | TRAFFIC |
| North America | +17% | -3% | +21% | +.5% |
| United Kingdom | +12% | -8% | -4% | -12% |
| Europe | +9% | -4% | +1% | -9% |
| APAC | +7% | +3% | +17% | +5% |
| LATAM | +6% | +12% | -6% | -16% |
Performance data by industry
Median percentage differences (2021 vs. 2020) as of 12:00 AM UTC on Friday, November 26 until 12 PM UTC on Monday, November 29, 2021.
| INDUSTRY | AOV | CONVERSION RATE | SALES | TRAFFIC |
| Fashion & Accessories | +11% | -8% | +6% | -1% |
| Health & Beauty | +9% | -3% | +5% | -5% |
| Home & Garden | +10% | -5% | +3% | -13% |
| Sporting Goods & Hobbies | +11% | +38% | +1% | -9% |
| Pet Supplies | +6% | -1% | +9% | -31% |
Performance data by device
Median percentage differences (2021 vs. 2020) as of 12:00 AM UTC on Friday, November 26 until 12 PM UTC on Monday, November 29, 2021.
| DEVICE | CONVERSION RATE | TRAFFIC SHARE | SALES SHARE | ORDERS SHARE |
| Mobile | +4% | +13% | +49% | +45% |
| Desktop | +3% | +67% | +52% | +55% |
Our full data analysis spanned 12:00 AM UTC on Friday, November 26 until 12 PM UTC on Monday, November 29.
Online Black Friday statistics: a comparison of U.S. and UK sales
Black Friday originated the U.S. and not only do sales still dominate here, but the U.S. occupied the highest online search interest for Black Friday in 2021.
While it’s true that the shopping holiday began in North America and remains the largest in the U.S. market, it caught wind in other countries and spread across the globe in recent years.
U.S. Black Friday online sales
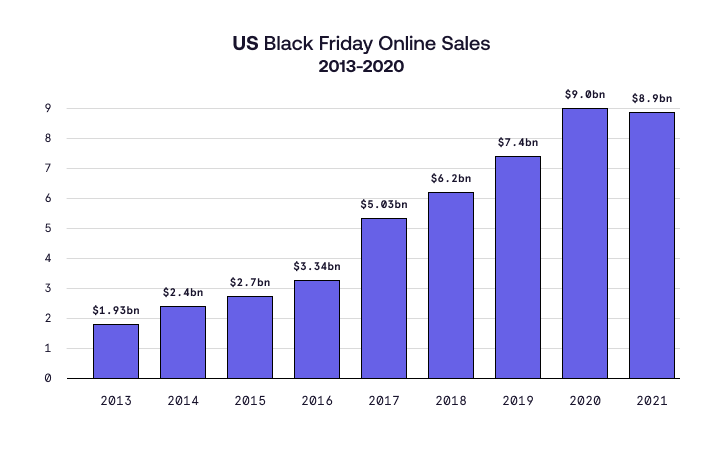
U.S. retailers generated over $9 billion in online Black Friday sales from 2013 to 2019, with growth percentages increasing year-over-year. The growth was so dramatic, in fact, that sales in 2020 surged 22% (from 2019) to a record $9 billion for that year alone.
However, 2021 told a different story. For the first time ever, Adobe Analytics reported a drop in Black Friday sales to 8.9 billion—just shy of the 2020 record. Some theorize this was the result of lingering pandemic effects (out-of-stock items, longer shipping times, etc) in addition to earlier online deals perhaps stealing some of the momentum.
UK Black Friday online sales
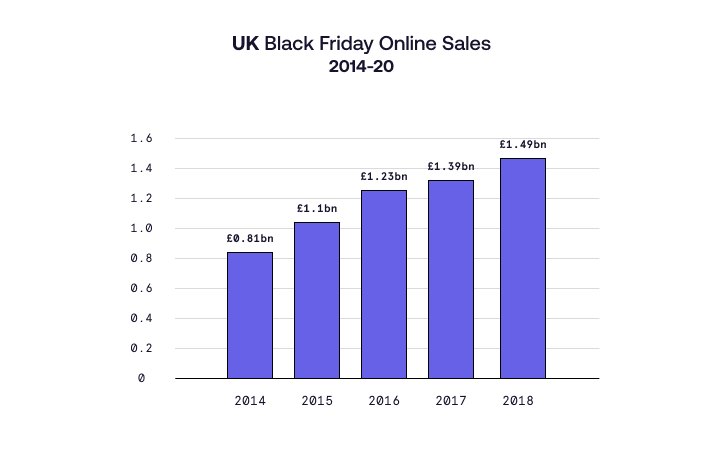
While the U.S. has seen exponential Black Friday sales growth over the years, nations like the UK have seen a slower rise when we look back. For instance, the UK’s total Black Friday online sales for 2018 amount to less than the U.S.’ total sales 5 years prior in 2013. Nevertheless, with every new year, shoppers spend an increasing amount in the UK.
Black Friday vs. Cyber Monday year-by-year
Black Friday is not a one-day affair, and shoppers who want to snag some extra virtual deals also leverage Cyber Monday. But how do the two days compare to one another? We analyzed both Black Friday and Cyber Monday performance, split by:
- Black Friday/Cyber Monday sales statistics
- Black Friday/Cyber Monday traffic statistics
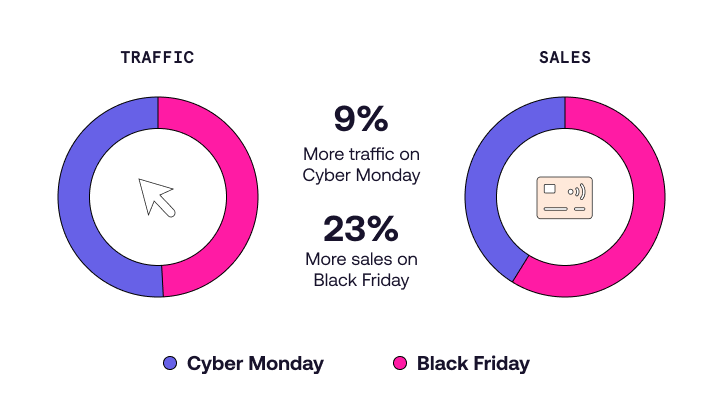
Black Friday vs. Cyber Monday – 2021 performance
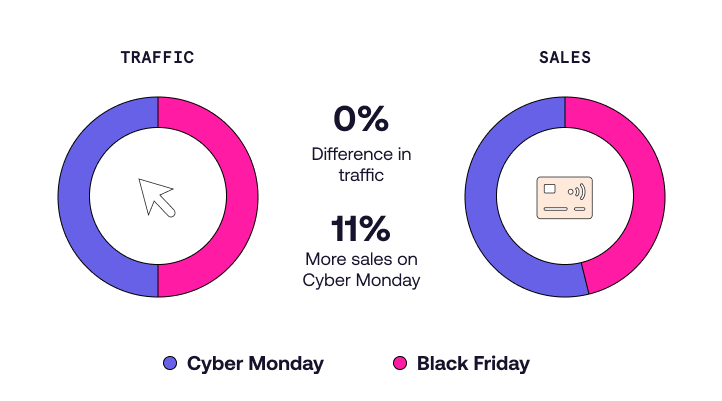
Black Friday vs Cyber Monday – 2020 Performance
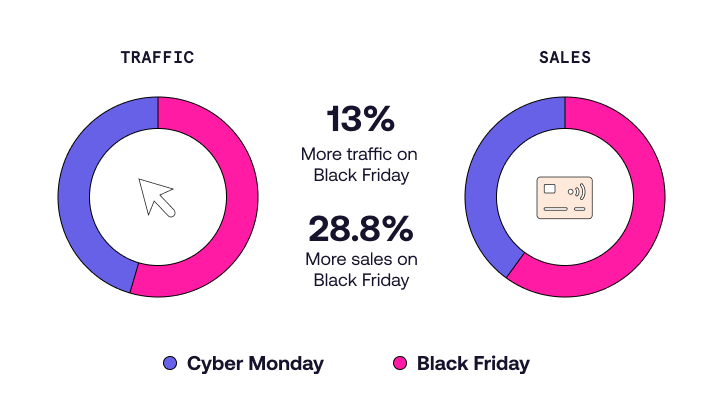
Black Friday vs Cyber Monday – 2019 Performance
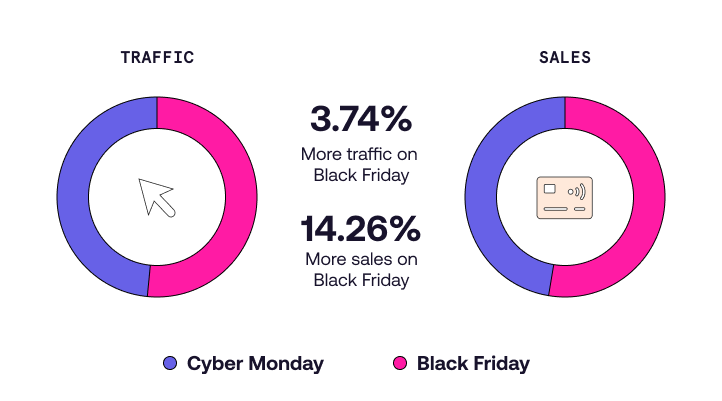
Black Friday vs Cyber Monday – 2018 Performance
The retail trends that drive Black Friday & peak season sales
Bearing in mind the post-pandemic shifts in consumer behavior, it is more important than ever for retailers to provide consumers with online experiences that delight.
Understanding the online trends that push shoppers toward action can make a difference in things like bounce rate, time on site, and more. During this critical shopping period it’s essential to be proactive in how consumers are experiencing your brand not just for Black Friday, but throughout peak season, 2022, and beyond!
Customers value free shipping
Everyone loves a little free shipping incentive when dishing out the big bucks during the holidays—especially during times like these (Amazon has been known to go as far as offering every customer free shipping during the holiday season).
Offering free shipping is a small but effective way to establish brand loyalty and drive better conversion and retention.
One thing to keep in mind: while free shipping is a major perk in the eyes of most consumers, most do not consider it a promotion. An estimated 38% of shoppers won’t actually shop somewhere if the brand isn’t offering free shipping.
To maximize average order value over the course of the holiday season, consider offering free shipping to shoppers who hit a specific dollar amount. You can even personalize your shoppers’ cart page by showing them product recommendations so they reach the threshold.
Social media as a discovery channel
Social media has risen to become a dominant source of product and brand discovery all year round. Naturally, it is also key in driving visibility for those exclusive peak season deals.
Year after year, shoppers flock to social media to suss the best bargains, look for gift inspiration, and to stumble upon the odd find they never knew existed. To convert all the extra eyes that peak season brings, you will want to leverage as much user-generated-content (UGC) on your social channels as possible—especially since 79% of people say UGC highly impacts their purchasing decisions.
By using and publishing content from enthusiastic customers, you will almost certainly acquire new customers during peak season (and get even more UGC content to boot). Hurrah! Just remember to have someone dedicated at keeping up with all of the buzz it starts to generate (share, like, comment, repost—you know the drill) so featured customers feel noticed and motivated to create even more content thereon.
Quick tip: Don’t forget those holiday themed hashtags! Oh, and if you create a campaign hashtag, consider a name that can live on beyond peak season to give any trending traction more longevity.
Watch for Black Friday sales momentum after Black Friday weekend
Remember, Black Friday does not live in a vacuum. The Black Friday (and Cyber Monday) sales weekend marks the start of the holiday sales season.
Historically, about 37% of all U.S. holiday retail sales are made during the BFCM period, yet only about 18% of consumers say that they finish their holiday shopping by this time.
Ever heard of Cyber Week II? This is the period after Christmas when consumers are armed with gift cards and ready for shopping bonanza round two. It is traditionally the most popular sales period across several markets worldwide.
You can incentivize people to continue making holiday purchases by creating personalized offers. This could mean displaying holiday-specific products as someone explores the website, or sending an email reminder of items a shopper browsed but did not purchase. It goes a long way in maximizing the chances of increasing your sales during peak season.


